IMPLICATIONS FOR FUTURE RESEARCH ON
SEA LEVEL CHANGE ALONG FLORIDA’S BIG BEND COASTLINE
George M. Cole, PE, PLS, PhD
SEA LEVEL CHANGE ALONG FLORIDA’S BIG BEND COASTLINE
George M. Cole, PE, PLS, PhD
Sea level has been in a state of flux throughout the history of the world. A glimpse into that change may be obtained by examining the geologic history of a land mass such as the Florida Peninsula. From about 200 million years ago at the time of the origin of that peninsula until about 23 million years ago, much of Florida was submerged under a shallow ocean accumulating a limestone base layer. In North Florida, the prominent Cody Scarp is a reminder of where the coastline was located during that period. After that time, the sea level began to drop until the time of the last glacial maximum when Florida reportedly had about three times its present land mass. At that time the ice began melting and sea level began rising. The scale of the most recent sea level rise since the last glacial maximum, has been quantified by a report published by the Florida Geological Survey (Balsillie and Donaghue 2004). That report provides an analysis of 341 separate radiocarbon dated sea level indicator points based on 23 independent field studies in the northern Gulf of Mexico. For that report, the authors used a seven-point averaging process after converting the elevations for each point to absolute years from radiocarbon years, considering 1950 as zero or present sea level. When the results from that report are plotted, they provide a good overview of the trend of sea level in the northern Gulf of Mexico over the last 22,000 years (Figures 1 and 2). As may be seen from those figures, a least squares regression through those points suggests an average rise of 6.0 mm/year over the last 22,000 years, and 2.3 mm/year over the last 10,000 years. Those changes are considered to be associated with melting of grounded ice, thermal expansion, and redistribution of water mass, all associated with the long-term climate change that has taken place during the last 20,000 years or so. (See Figure 1 Below/ hold over for level changes)
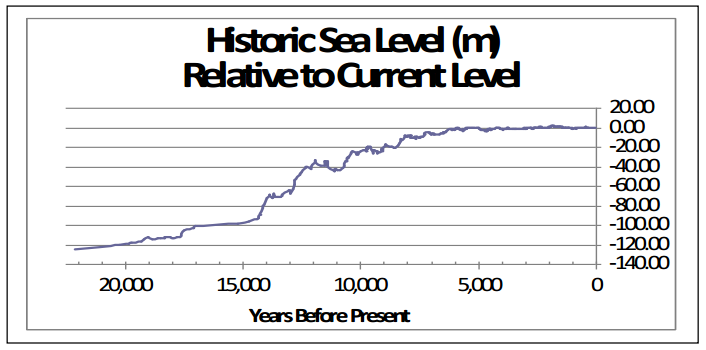
Figure 1
Estimated Sea Level Change over Previous 22,000 Years
Based on data from Basillie and Donaghue 2004
Average rate of rise over depicted period: 6.0 mm/yr
Over 1st 10,000 yrs: 10.4 mm/yr, Over last 10,000 yrs: 2.3 mm/yr
Estimated Sea Level Change over Previous 22,000 Years
Based on data from Basillie and Donaghue 2004
Average rate of rise over depicted period: 6.0 mm/yr
Over 1st 10,000 yrs: 10.4 mm/yr, Over last 10,000 yrs: 2.3 mm/yr
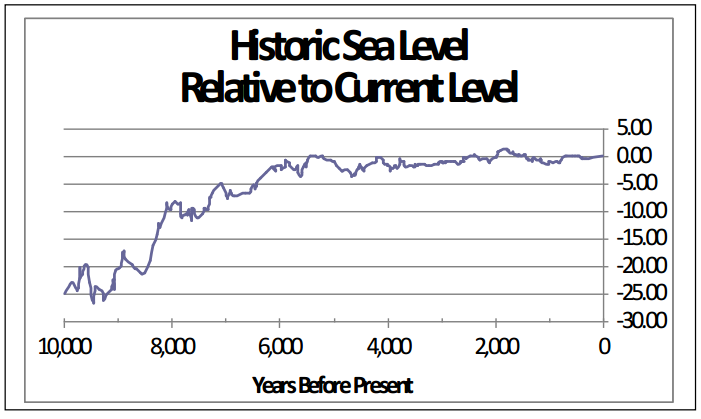
Figure 2
Estimated Sea Level Change over Previous 10,000 Years
Based on data from Basillie and Donaghue 2004
Average rise over last 10,000 yrs: 2.3 mm/yr, Over last 5000 yrs: 0.5 mm/yr
Estimated Sea Level Change over Previous 10,000 Years
Based on data from Basillie and Donaghue 2004
Average rise over last 10,000 yrs: 2.3 mm/yr, Over last 5000 yrs: 0.5 mm/yr
The above trends (figure 2) reflect averages over many thousands of years. Within those periods, there were numerous short term trends with periods of a few hundred years or so, with sea level trends considerably different from the average over the entire period (Figure 3). As examples, from about 150 to about 950AD, a period of about 800 years, the data suggest a falling sea level trend of -3.0 mm/yr. At the beginning of that period the data indicate that sea level was more than a meter above current levels. That downward trending period was followed by about 1000 years (from 950AD to present) with a rising slope of about 1.5 mm/yr. Within that 1000-year period, there was a sub-period of rapid rise (950 – 1250) during the so-called “medieval warm period”; and another of rapid decline during the “little ice age” (1300AD and 1850AD) when much of the world was subjected to cooler winters than in subsequent centuries.
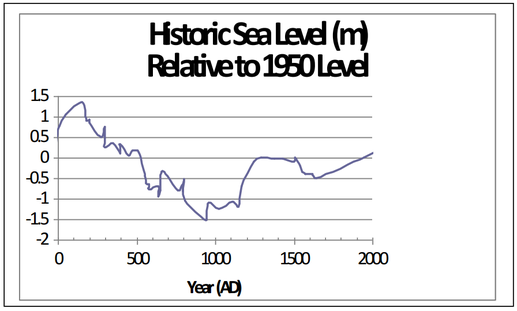
Figure 3
Estimated Sea Level Change over Previous 2000 Years
Based on data from Basillie and Donaghue 2004
Average rise over last 10,000 yrs: 2.3 mm/yr, Over last 5000 yrs: 0.5 mm/yr
Estimated Sea Level Change over Previous 2000 Years
Based on data from Basillie and Donaghue 2004
Average rise over last 10,000 yrs: 2.3 mm/yr, Over last 5000 yrs: 0.5 mm/yr
In more recent history, records from sea level gauges are available that allow direct observation of the rate of sea level changes (Cole 1997), as opposed to reliance on the dating of sea-level indicators. The longest operating of such stations worldwide is in Historic Sea Level (m) Relative to 1950 Level -2 -1.5 -1 -0.5 0 0.5 1 1.5 0 500 1000 1500 2000 Year (AD) 4 Brest, France which has been recording sea levels since 1807. The station with the longest records in the United States is San Francisco, established in 1855, which indicates an average rise of 1.89 mm/year (Figure 5). As may be seen, the data for that station records reflect a relatively constant slope over the century and a half period. For the same period, the Brest, France station has a rate of 1.30 mm/year. Those rates also reflect global averages per the following statement of the Intergovernmental Panel on Climate Change (IPCC 2001):
“Based on tide gauge data, the rate of global MSL rise during the twentieth century is in the range of 1.0 to 2.0 mm/year, with a central value (not necessarily the best estimate) of 1.5 mm/year.”
It is noted that these trends are over relatively short periods of observation compared to those based on carbon dating previously presented.
Figure 4
Annual Mean Sea Level at San Francisco Based on NOAA Data
Average Mean Sea Level Rise: 1.4 mm/yr
Average rise over last 10,000 yrs: 2.3 mm/yr, Over last 5000 yrs: 0.5 mm/yr
Along the Florida coastline of the northern Gulf of Mexico, the National Oceanic and Atmospheric Administration (NOAA) maintains long-term gauges at Cedar Key, Apalachicola, Panama City and Pensacola. Plots of annual mean sea level for those stations using all available data, along with the average rates of increase, are provided in Figure 5.
Figure 5
Annual Mean Sea Level Based on NOAA Data
Annual Rates of Sea Level Change:
Cedar Key: 1.89 mm/yr, Apalachicola: 1.76 mm/yr
Panama City: 1.60mm/yr, Pensacola: 2.19 mm/yr
By observing gauging data at various locations, it may be readily seen that the apparent rates of sea level rise as measured by gauges appear to vary somewhat with location. This is in large part a result of local land motion rather than actual sea level change. As an example, progressing westerly from along the northern coast of the Gulf of Mexico, there is an increase in the rates of apparent sea level rise as illustrated in the following table (data from tidesandcurrents.noaa.gov):
Station Rise (mm/year)
Panama City, FL 1.73
Pensacola, FL 2.21
Dauphine Is., AL 3.10
Bay Waveland, MS 3.93
Grand Is., LA 9.03
New Canal, LA 4.50
Sabine Pass, TX 5.42
Galvanston, TX 6.34
Rockport, TX 5.27
Corpus Christi, TX 3.50
Port Isabel, TX 3.79
As may be seen, that increase culminates in areas along the Louisiana coast where there is the highest apparent rise in the United States (e.g. 9.03 mm/year at Grand Isle). The differing apparent rises are believed to be related to local land movements. Since sea level changes are measured relative to a fixed bench mark on land, measured sea level changes include both true sea level changes and vertical land movement due to various factors including earthquakes, tectonic motion, consolidation of coastal sediments, consequences of extraction of oil or water, and responses of the earth to the melting of glaciers (Pugh 2004).
The effect of local land movement on apparent sea level is graphically illustrated by comparing data for sea level change at Grand Isle, Louisiana and from Southeast Alaska. There is a decline in apparent mean sea level of 13.2 mm/year at Juneau, believed to be related to glacial rebound. Continuous GPS observations at both Juneau and Grand Island, Louisiana confirm the effect of the suspected local land movement (Figure 6). GPS observations at Juneau indicate a current uplift rate of approximately 13.6 mm/year which implies that actual sea level rise at Juneau would be roughly ( -13.2 –(- 13.6)) or 0.4 mm/year. At Grand Isle where the apparent sea level rise is 9.03 mm/year, GPS observations indicate a current subsidence rate of approximately 8.1 mm/year which implies that actual sea level rise at Grand Isle would be roughly (9.03 – 8.1) or about 0.9 mm/yr. Therefore, in some areas, local geological mechanics are a greater factor in apparent sea level rise than actual sea level.
Figure 6
Annual Mean Sea Level based on NOAA Data
Apparent Average Mean Sea Level Change:
Juneau, AK: -13.6 mm/yr;
Grand Is., LA: +9.0 mm/yr
As may be seen from the previous two sections, (and contrary to popular misperception possibly caused by misleading sensational media) sea level rise is not a new phenomenon. Rather, sea level has been in a state of flux throughout the history of the world. Further, contrary to some popular beliefs, the rate of actual sea level rise does not seem to have increased significantly over the last century. Nevertheless, sea level has generally been on a significant upward slope over the last 20,000 years since the last glacial maximum and continues to be so today. Further, that rise has and will continue to have a significant impact on vegetative and animal life, including humans. Moreover, considering the nature of modern civilization today with its more developed coastal infrastructure, changing sea level will probably have far greater impact today than earlier in the history of the earth.
As a result, there is a significant need for research in not only the nature of sea level change itself and its relationship to climate and crustal motion, but also on its effect on the geology and hydrogeology of the earth, on how animal life and vegetation adapt to such change, and the effect of that change on mankind and modern civilization. The Big Bend area of Florida offers an ideal laboratory for such studies. That area was home to one of the earliest human populations in the United States which was obviously affected by sea level change. The area also has seen an amazing variety of other animal and plant life over the history of the North American continent which has been affected by sea level change. In addition, the area offers spring-fed rivers, a unique karst geology, and an important aquifer immediately adjacent to and under the coast that are all strongly affected by sea level change.
Specifically, the following research is needed in this region:
REFERENCES
Balsillie, James H. and Joseph F. Donaghue. “High Resolution Sea-Level History for the Gulf of Mexico since the Last Glacial Maximum”, Florida Geological Survey Report of Investigation No. 103, 2004.
Cole, George M. “Airborne LiDAR Hydrography for Managing Florida’s Water”, Hydrography – More than Nautical Charting, www.nauticalcharts.NOAA.gov. 2014. Cole, George M. Water Boundaries, New York: John Wiley & Sons, 1997.
Intergovernmental Panel on Climate Change (IPCC). Cambridge: Cambridge University Press. 2001.
Pugh, David. Changing Sea Levels, Cambridge: Cambridge University Press. 2004.
As a result, there is a significant need for research in not only the nature of sea level change itself and its relationship to climate and crustal motion, but also on its effect on the geology and hydrogeology of the earth, on how animal life and vegetation adapt to such change, and the effect of that change on mankind and modern civilization. The Big Bend area of Florida offers an ideal laboratory for such studies. That area was home to one of the earliest human populations in the United States which was obviously affected by sea level change. The area also has seen an amazing variety of other animal and plant life over the history of the North American continent which has been affected by sea level change. In addition, the area offers spring-fed rivers, a unique karst geology, and an important aquifer immediately adjacent to and under the coast that are all strongly affected by sea level change.
Specifically, the following research is needed in this region:
- Considering the rise in sea level over the last 20,000 years, much of the evidence needed for the suggested research into the nature and impact of sea level change lies beneath the near-shore waters, an important step towards such research is the development of high resolution maps of those waters. Almost all existing hydrographic charts are based on widely-spaced sounding lines. Although helpful for navigation, they do not provide a high-resolution coverage of the submerged lands. Further, the coverage of existing hydrographic charts often does not include many non-commercially navigable coastal areas or any significant areas up streams and rivers. Therefore, a data base of high-resolution maps createdwith a technology such as bathymetric LiDAR (see Cole 2014) is essential for future research.
- Possibly the most important ingredient for research on sea level change is a dense network of continuously operating water level gauges. NOAA has been diligently working towards that goal. Yet, the Gulf Coast between Cedar Key and Apalachicola is one of the longest stretches of shoreline in the U.S. where there is no real-time automated monitoring of sea level. Such a gauge together with frequent ties to high stability bench marks for this area is needed.
- Associated with the need for such a gauge is the need for continuous, or frequently scheduled, GPS observations at the gauge to allow separation of true sea level change and land motion.
- NOAA ‘s National Geodetic Survey coordinates a network of GPS stations, some of which are co-located with tide stations. There is a need for a systematic nation-wide analysis of data from those stations to get a truer picture of actual sea level change nation-wide as well as vertical land movement which has the same effect as sea level change.
- There is need for systematic archeological studies of the impact of sea level change on the distribution and adaptation of plant and animal life in the past, including studies of past human settlements in areas now covered by the Gulf , how such settlements were affected, and how they adapted.
- Considering the numerous freshwater springs in areas now under the waters of the Gulf in the Big Bend, there is need for hydrogeological studies to examine the effect of sea level change on these springs and on the water of the Floridan Aquifer feedig those springs.
- In addition, on a closely related topic, there is a need for research into the long-term trends of the level of the Floridan Aquifer considering both the changing level of the aquifer as well as salt water intrusion. Both of are closely related to sea level change and are of significant importance to future land use planning.
REFERENCES
Balsillie, James H. and Joseph F. Donaghue. “High Resolution Sea-Level History for the Gulf of Mexico since the Last Glacial Maximum”, Florida Geological Survey Report of Investigation No. 103, 2004.
Cole, George M. “Airborne LiDAR Hydrography for Managing Florida’s Water”, Hydrography – More than Nautical Charting, www.nauticalcharts.NOAA.gov. 2014. Cole, George M. Water Boundaries, New York: John Wiley & Sons, 1997.
Intergovernmental Panel on Climate Change (IPCC). Cambridge: Cambridge University Press. 2001.
Pugh, David. Changing Sea Levels, Cambridge: Cambridge University Press. 2004.
BIOGRAPHICAL INFORMATION
George M. Cole is a professional engineer, surveyor and geographer and a member of the Board of Directors of Aucilla Research Institute. Cole holds a bachelor of science degree in mathematics from Tulane University as well as master of science and doctor of philosophy degrees in geography from Florida State University. His background includes several years of service (final rank: Lt. Commander) with the U.S. Coast & Geodetic Survey (now part of NOAA); as the State Cadastral Surveyor for Florida; as President of an engineering and surveying firm with projects including LiDAR surveys in Central America; and as a professor at the University of Puerto Rico. Cole currently serves as a private consultant and continues to serve as an Adjunct Professor at both the Florida State University and at the University of Puerto Rico. Cole has served as technical advisor to several states on boundary issues; and has provided expert testimony to a number of local, state and federal courts. He also has made significant contributions to professional literature and is the author of several surveying textbooks (with notable examples being Water Boundaries, John Wiley & Sons, 1997, Surveyor Reference Manual, Professional Publications, 2009, and Land Tenure, Boundary Surveying and Cadastral Systems, Taylor & Francis, 2016.